
In this article, I am introducing an item analysis software tool that I use, as a teacher, to enrich my education. And it is totally free for you to use!
It consists of a spreadsheet that provides a quality check of the test that I used. Most importantly I am able to use the generated data as valuable personal feedback material for my students.

The test matrix
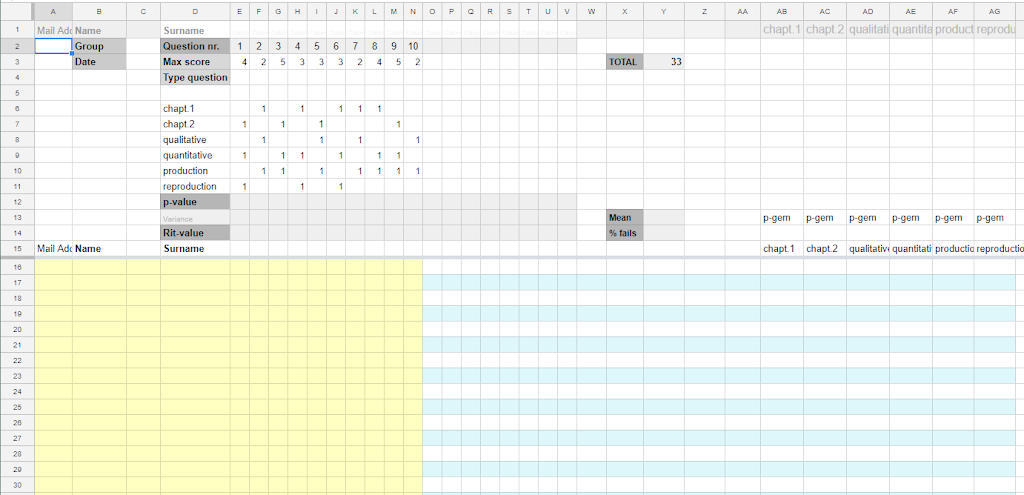
The first stage of the spreadsheet consists of the test matrix. Here the weight factor of all questions (or problems) must be filled in (the spreadsheet handles at the moment a maximum of 18 questions). Each question can furthermore be labeled into a maximum of 7 categories, depending on the subject you teach an on the learning factors that you want to monitor. After filling, the matrix also provides a fast and easy check beforehand of the validity and quality of the test.
The example test consists of 10 questions, with a maximum total score of 33 points.
The individual test results
Now it is time to fill in the names of all participating pupils. When the email addresses are also included, communication with the pupils can be greatly facilitated. This spreadsheet is developed to work seamlessly with the ‘YAMM’ mail add-on within the Google Education environment.
The detailed results of the tests must, of course, be filled in, per individual pupil.
Analysis of the test results on a group scale
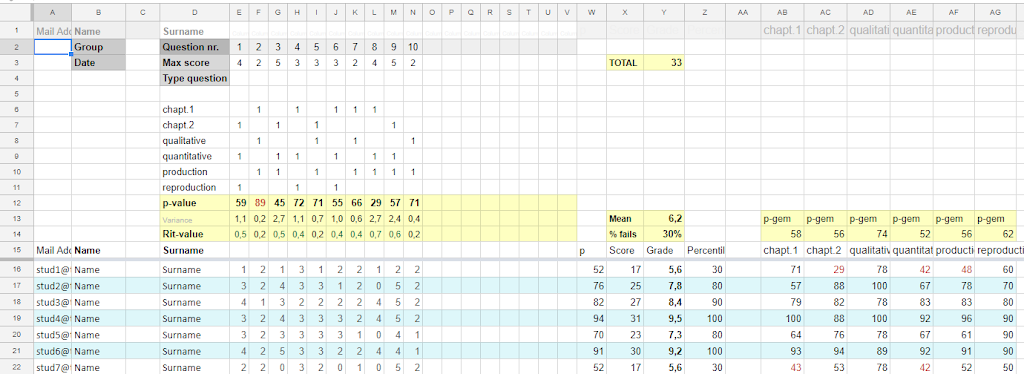
When al test results are copied into the spreadsheet some interesting variables are visible to be judged by you. The class average score (Mean), the percentage of fails. But also the p-value and Rit value of every question of the test are presented. The Rit value quantifies the discriminating power of the question. Rit values become really meaningful only when the number of students exceeds 50.
You can now verify the validity of each of your individual questions. A p-value between 0,3 and 0,8 is desirable, as is a Rit value greater than 0,2. Deviations light up in red.
For each of the categories that you decided to include in your analysis, the class average p-value is also presented.

These general test results form a powerful instrument for you as a teacher. With it you can investigate the trustworthiness of the test as a whole. Weak questions will stand out as such. By replacing, or reformulating, these weak questions with a view to future use of this test, the quality, and thus the effectiveness, of the test can be improved. Questions and/or categories with a low score could also indicate attention points for future lessons. In our example, the students struggled significantly more with the quantitative problems in the test, questions where they had to calculate. I can choose to adjust the activities in my lessons accordingly.

Analysis of the results on an individual scale
You also gain valuable information on the absolute and relative results of each of your pupils. The score and grade are depicted, as well as the percentile score of the pupil, rounded to the nearest decade (students with a percentile score below 20% receive the somewhat less punitive ‘<20 o:p=””>
Furthermore, the percentages per category are calculated and made visible. Scores below 50% light up in red. Now you can zoom in on specific qualities and deficiencies of each of your students. Subsequently, you have the choice to share some or all of these results with your students. It can be a part of a standard reflection activity (please read my article on this, ‘Good practice 3’). I share this insightful information with my pupils by means of an automatically generated and personal mail, or in the form of a reflection form.

Conclusion
Bringing this analysis tool into my system I am experiencing four advantages:
- Filling in the matrix forces me to reconsider the validity of the test that I am planning to deploy.
- The test results are saved together in one clear system. I noticed that I started to make fewer mistakes in the process of revising the test results. This alone more than compensated the extra time it takes to fill in all individual results of my pupils.
- I can evaluate the validity of my test, and of all of the questions in it. It enables me to improve the quality of my test, for future purposes.
And most importantly
- It enables me to give highly valuable, personal and data-based feedback to my students. So that I can help them better in the process of learning.